
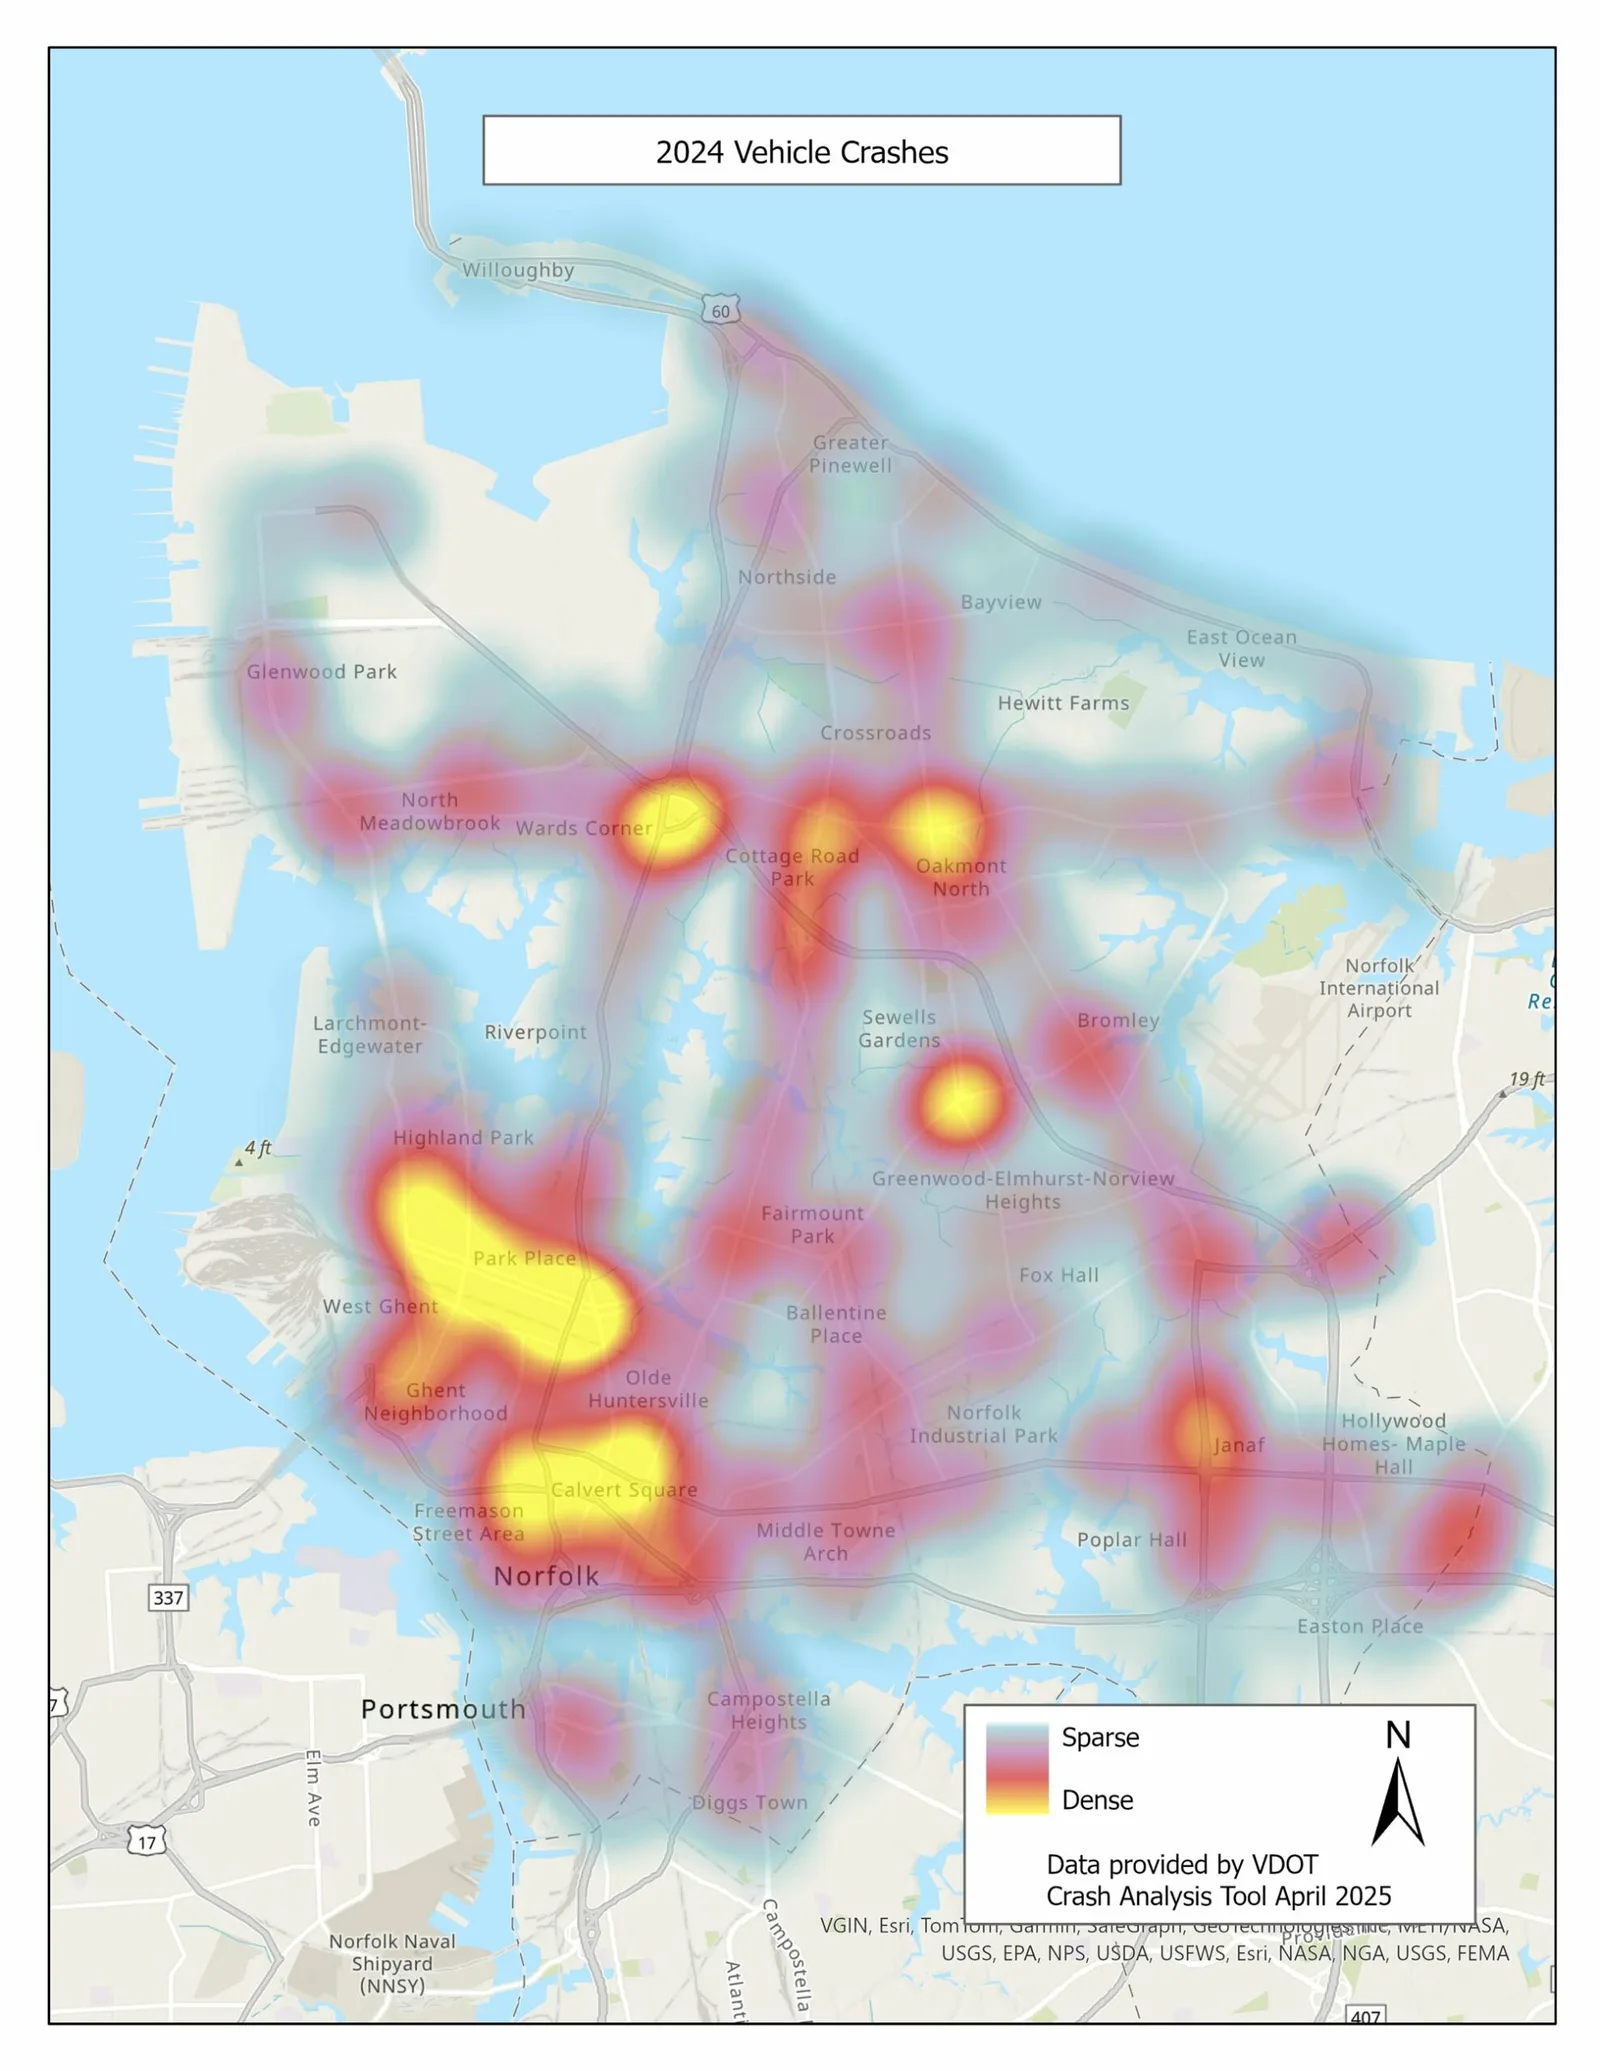
The images below are heat maps for all crashes (fatal and non-fatal) in 2023 shown separately for bike crashes (left), pedestrian crashes (middle), and vehicle only crashes (right). Through these maps, we can identify hot spots for each type of crash. This is important to show because where there are persistent issues for vehicles might be different than where there are persistent issues for bikes and pedestrians.
The map on the right shows bicycle crashes for 2016-2020 along existing bike facilities (bike lanes, sharrows/shared lane markings, and the Elizabeth River Trail). The total number of bicycle crashes reported within this 5-year period is 182. Of these, 27 crashes were on the bike network - 14 occurred on streets with sharrows/shared lane markings, 3 occurred in buffered bike lanes, and 10 were in unbuffered bike lanes. Most of the bicycle crashes reported (155) occurred outside of the bike network with 108 of these crashes occurring at intersections. This illustrates the importance of bike treatments at intersections as well as the overall safety benefits of bike lanes. Additionally, 44 of all bicycle crashes occurred at night.
Looking at the Norfolk Bicycle & Pedestrian Strategic Plan corridors, there were 63 bicycle crashes that occurred with the following breakdown:
- Corridor 1: Olney Rd. - Hospitals to Norfolk State University = 0 crashes
- Corridor 2: Llewellyn Ave. and Lower Granby St. & Boush St. Alternatives = 9 crashes
- Corridor 3: Granby St. - Willow Wood Dr. to Ocean View Ave. = 6 crashes
- Corridor 4: Harbor Park and Tide Station to Five Points = 0 crashes
- Corridor 5: Downtown-Old Dominion University-Naval Station Connector = 15 crashes
- Corridor 6: Indian River Road - South Norfolk Connector = 1 crash
- Corridor 7: Cromwell Drive and Robin Hood Road Cross-City Connector = 5 crashes
- Corridor 8: Cape Henry Trail Interim Route = 3 crashes
- Corridor 9: Southside Bikeways = 0 crashes
- Corridor 10: Ocean View Avenue and Shore Drive East-West Connector = 8 crashes
- Corridor 11: Ingleside Road Tide Station to Airport via Azalea Garden Road = 5 crashes
- Corridor 12: Sewells Point Road and Chesapeake Boulevard Bikeway = 11 crashes
In 2022, the total number of fatal crashes recorded in Virginia was 1,005 (up from 968 in 2021) with speeding being the top driver contributing factor for all fatal crashes. According to the 2022 Virginia Traffic Crash Fact Report, 43.9% of all fatalities recorded in Virginia in 2022 were speeding related.
The total number of fatal crashes recorded in Norfolk in 2022 was 23 (down from 28 in 2021) with alcohol and speed being the top driver contributing factors for all fatal crashes. 43.5% of all fatalities were alcohol related and 39.1% were speeding related. Vehicle speed increases both the likelihood of a crash, as well as the severity of the crash, as it diminishes a driver’s ability to recognize and avoid potential conflicts. (Source: 2022 Virginia Traffic Crash Facts)
In 2019, the total number of commuters recorded in Norfolk was 131,994 with 73.4% of commuters traveling by car (driving alone). Commuting on foot (8.3%) ranked higher than commuting by public transportation (4.4%) and both modes ranked higher than commuting by bike (0.9%).
In 2022, the total number of commuters in Norfolk was 126,216 with 74.0% of commuters traveling by car (driving alone). Carpooling (10.9%) ranked the next highest with teleworking (7.2%) closely behind. Interestingly, the share of commuters teleworking decreased from 11.6% in 2021 to 7.2% in 2022. Commuting on foot, by public transportation, and by bike saw a decrease from 2019 making up 3.8%, 1.9%, and 0.4% of commuters, respectively. (Source: U.S. Census Bureau American Community Survey)
In 2019, the total number of fatal crashes recorded in Norfolk was 24 with 63% of these crashes involving vehicles only. Fatal crashes involving pedestrians ranked next making up 25% of the recorded fatalities. There were no recorded bike fatalities in 2019.
In 2022, the total number of fatal crashes recorded in Norfolk was 23 with 26% of these crashes involving vehicles only. This is down from 41% of vehicle-only fatal crashes in 2021. Fatal crashes involving pedestrians ranked the highest making up 57% of the recorded fatalities. Fatal crashes involving motorcycles ranked last making up 17% of recorded fatalities. (Source: VDOT Crash Analysis Tool)
In 2019, 22.5% of all recorded pedestrian crashes were fatal and serious injuries. For vehicles, 8% of all vehicle-only crashes involved fatalities and serious injuries. There were no fatal crashes recorded for bikes in 2019. However, 12% of all recorded bike crashes resulted in serious injuries.
In 2022, 43% of all recorded pedestrian crashes were fatal and serious injuries. For vehicles, only 3.3% of vehicle-only crashes involved fatalities and serious injuries. There were no fatal crashes recorded for bikes in 2022. However, 14% of all recorded bike crashes resulted in serious injuries. These statistics highlight how pedestrians and cyclists are Norfolk’s most vulnerable road users with pedestrians suffering the highest rates of fatal and serious injury crashes.
Fatal crashes per 100,000 population 2016-2020Fatal crashes per 100,000 population in Norfolk between 2016 and 2020, 7.3 and 10.5 respectively, have been relatively low compared to other similarly sized cities. Norfolk’s numbers also fall below the national number of fatal crashes per 100,000. However, since 2019, the gap between Norfolk's numbers and the national numbers has been shrinking. The graph below compares fatal crashes in Norfolk to four cities with similar populations as well as with the U.S. (Population data source: U.S. Census Bureau Annual Estimates of Resident Population; Crash data source: National Highway Traffic Safety Administration/FARS)
The City of Norfolk initiated a Bike-Pedestrian Counter Program in March 2021 to provide a reliable method of data collection. This data will be used to advance the goal of making biking and walking more comfortable and more connected in Norfolk by better understanding the trends of pedestrians and cyclists in the city.
The first phase of counter installations focused on 15 existing bike lane locations. The second phase of counter installations will focus on other existing bike lane locations as well as new bike lanes implemented according to the Multimodal Transportation Master Plan and the City of Norfolk Bicycle and Pedestrian Strategic Plan.
Learn more about Norfolk's Bike-Pedestrian Counter Program and view the Bike and Pedestrian Trip Counts dataset on the Norfolk Open Data portal.